
The Worst Economy of Our Lifetime
Hale Stewart
HuffingtonPost
November 6, 2007
Concern about the economy, the war in Iraq and growing dissatisfaction with the political environment in Washington all contribute to the lowest public assessment of the direction of the country in more than a decade. Just 24 percent think the nation is on the right track, and three-quarters said they want the next president to chart a course that is different than that pursued by Bush.
…
Dissatisfaction with the war in Iraq remains a primary drag on public opinion, and Americans are increasingly downcast about the state of the economy. More than six in 10 called the war not worth fighting, and nearly two-thirds gave the national economy negative marks. The outlook going forward is also bleak: About seven in 10 see a recession as likely over the next year.
Yet last week the economic news was upbeat. The U.S. economy grew 3.9 percent and the economy added 166,000 jobs. Shouldn’t people be happy about those developments?
The answer is no they shouldn’t. As I noted in the first installment in this series, job and wage growth for this expansion is poor at best. Simply put, if you hadn’t had a meaningful raise for the duration of “greatest story never told” you’d be frustrated, too. But that poor job and pay growth only tell part of the story. The bottom line is the underpinnings of the Bush economy are terrible — and they are starting to come home to roost in a big way.
Before I move forward I’d like to address a point brought up in the first article in this series. Several people commented that the recession of the early 1980s was in fact the worst economy of our lifetime. I will admit that I was alive and well during that time, although I was just starting high school. While I would love to tell you I was economically aware at that time, the truth is I was more interested in playing guitar (stealing licks, playing in bands) going to parties and in general being a high school kid. I have no economic recollection of that early 1980s. So for people who were alive and, well, struggling during that time it may have been the worst economic period of their lives. But for me, watching friends struggle with getting by while being told everything is great in Republican-land for the last seven years has lead me to the conclusion that the current expansion is a cruel joke played on the vast majority of Americans. As the poll numbers indicate, I am far from alone; most Americans feel that way.
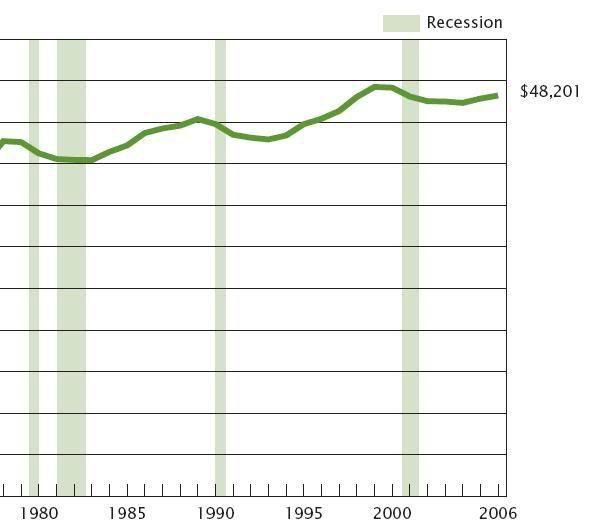
The question is, why? One of the primary reasons is the financial underpinnings of this expansion are poor. But let’s back-up to 2001. According to the Bureau of Economic Analysis, the personal savings rate was .46 percent in the fourth quarter of 2001. Another way to state this statistic is Americans were spending 99.5 percent of their personal income in the fourth quarter of 2001. Now, let’s look at the Census Bureau’s median income statistics. Here is a chart from their latest national income report.
 |
 |
 |
Notice how the median national income has stagnated? Yet over the duration of this expansion, personal consumption expenditures have increased 18.34 percent in chained (inflation-adjusted) dollars. So, at the beginning of this expansion people were already spending everything they made on a weekly basic. Over the last seven years income has stagnated, yet people have increased their purchases by 18.34 percent. Where did all this new money come from?
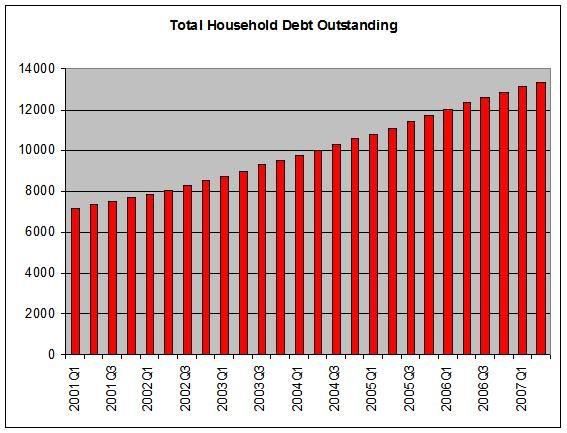
Tons of debt. Here is a chart compiled from information from the Federal Reserve’s Flow of Funds Report.
Let’s put some figures on that chart. In the fourth quarter of 2001, total household debt outstanding totaled $7.680 trillion dollars. In the second quarter of 2007, total household debt outstanding increased to $13.331 trillion — a 73.56 percent increase.Let’s place those figures in perspective.In the fourth quarter of 2001, total household debt was 75.10 percent of GDP. In the second quarter of 2007 it was 96.82 percentIn the fourth quarter of 2001, total household dent was 102 percent of disposable income at the national level. In the second quarter of 2007 it was 129.62 percent of personal income at the national level.Now, there is no economic magic line that says “debt above this level is bad.” However, let’s look at some recent headlines from the financial services industry to see where this debt has gotten us.From Bloomberg:
Stocks fell in Europe and Asia after Citigroup Inc.’s announcement of as much as $11 billion in writedowns suggested financial companies may face more losses. U.S. index futures retreated.
Merrill Lynch & Co Inc (MER.N: Quote, Profile , Research) reported $7.9 billion in net write-downs for the third quarter on Wednesday as shaky risk management and bad bets on subprime mortgages and collateralized debt obligations triggered the company’s first quarterly loss in six years.
….
Merrill was the only big Wall Street firm to post a third-quarter loss. And its write-downs — before hedges — was bigger than the combined $3.6 billion in write-downs and charges recorded by rivals Goldman Sachs Group Inc (GS.N: Quote, Profile , Research), Bear Stearns Cos Inc (BSC.N: Quote, Profile , Research), Morgan Stanley (MS.N: Quote, Profile , Research) and Lehman Brothers Holdings Inc (LEH.N: Quote, Profile , Research).
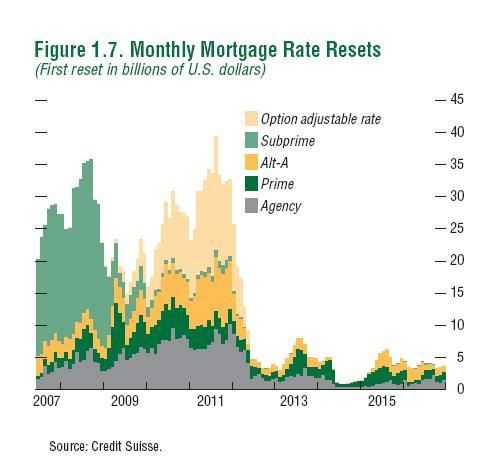
And as this chart from the IMF shows, we have at least another three years of resets to go through before we’re in the clear:
The problem with this debt is we have now partially crippled our economy going forward. The U.S. economy relies on the credit markets for a host of necessary economic activities. But those markets are not functioning smoothly right now. And the chart from the IMF indicates they won’t function smoothly for some time into the future. As a result, the U.S. economy will limp alone for the foreseeable future as the credit markets work-out their self-imposed problems. And that’s not good for anyone.
![]()
No comments:
Post a Comment